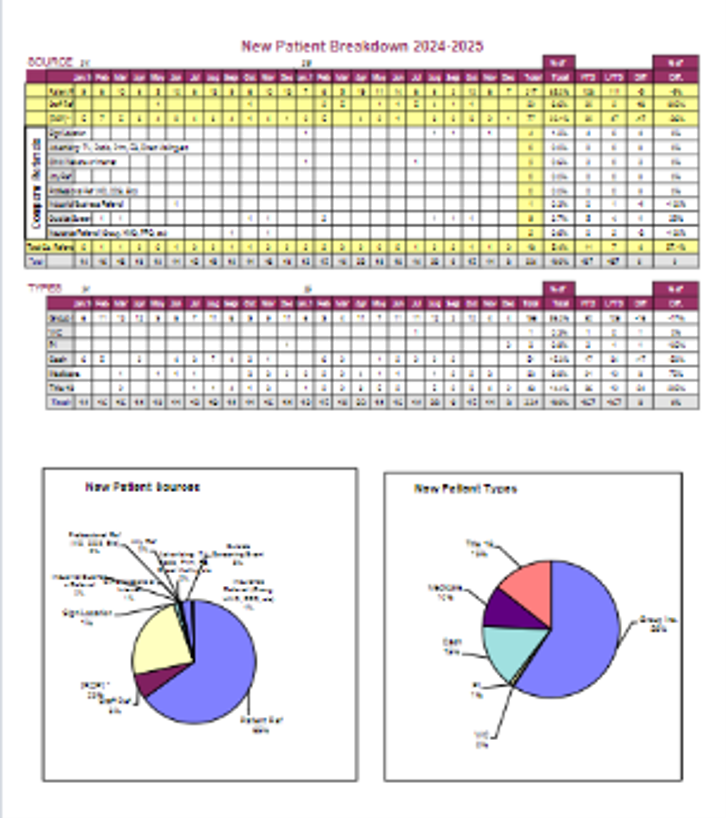
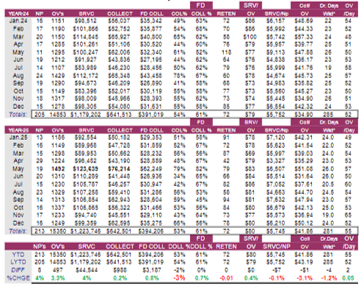
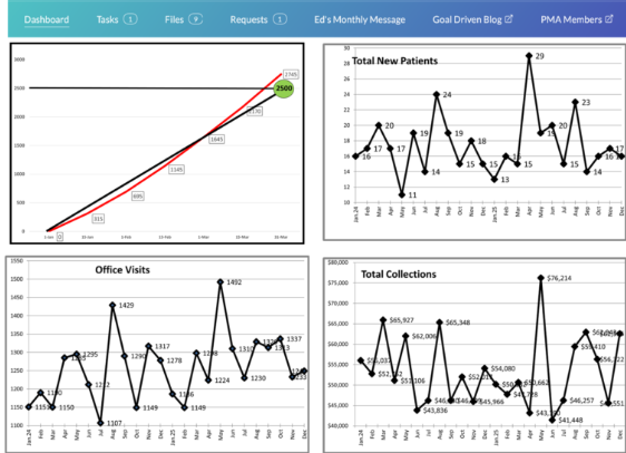
This is an example of what you will see when you click into your private portal.
You will be able to quickly see the status of you business – namely, is it improving, or not.
It will also provide you with the observations and recommendations from Ed Petty.
Monthly fee: $150/m first 3 months, then $350/m
Questions? Want to chat? Click below.

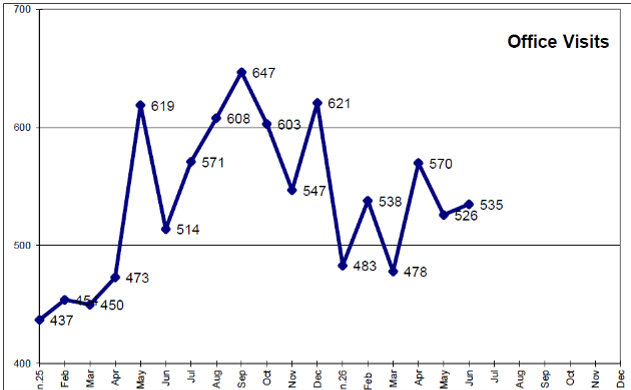 | 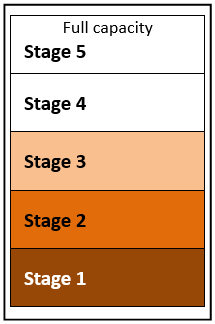 | Visits Year to date: Visits up 6% (183) Short trend: UP Long trend: (6 month) UP Trend Recommendations: This is the Stability Stage. Keep doing what has been working. Make slight adjustments as needed and note if the numbers go up. Since your new patients have been improving, keep doing what you are doing to generate those. |
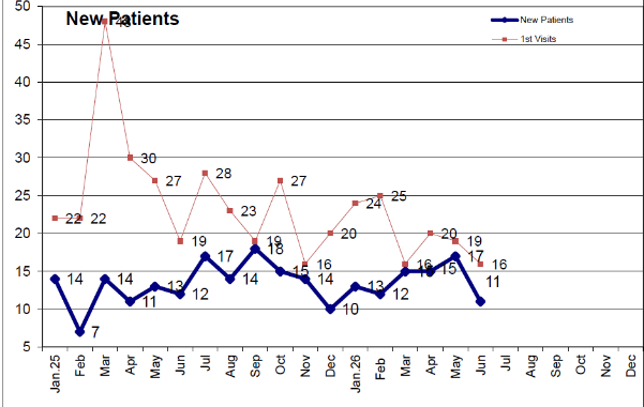 | New Patients Year to Date: • 1st visits down 29% (-48) • NPs up 17% (12) • Conversion % up xx % (69% this year to date.) Long trend: Flat to slightly up Short term: Down |
|
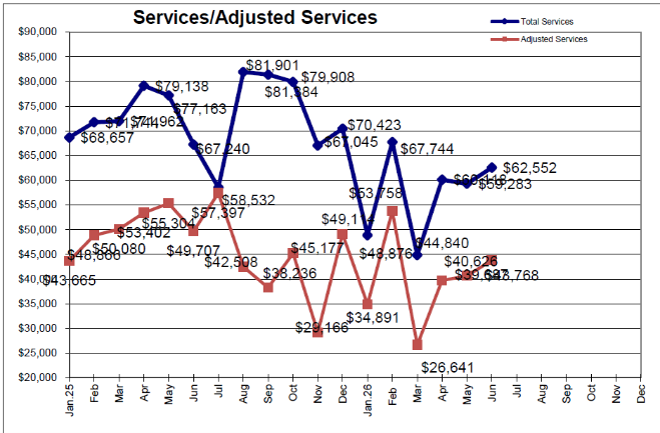 | Services Year to date: Services down 21% (-$92,491) Long trend. Down. Short trend. Up |
|
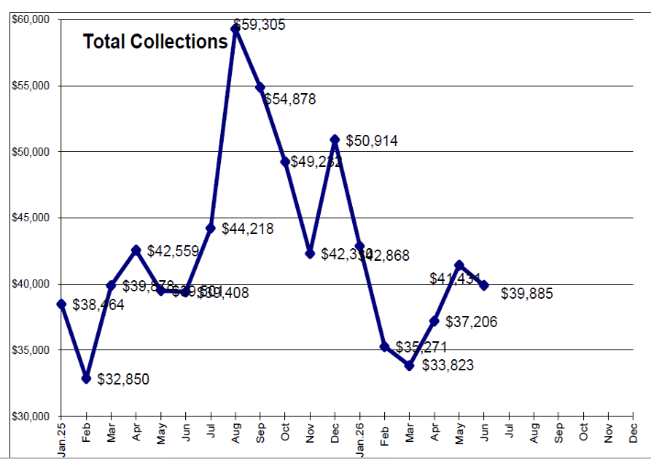 | Collections Year to date: Down 1% (-$2,045) (Much less than Services.) • Collection % last year to date: 58% • Collections % this year to date: 72% Long trend (12 months). Down Short trend (5 months) Up |
|
| Each month we collect your numbers, process them, and review them closely. We then post your stats, graphs, with my observations and recommendations on your Executive Portal. We also mail you a hard copy. | ||
| Monthly statistics: • Track New Patients, Patient Visits, Services and Collections. • Current month compared to the prior month • Current month compared to the same month of the prior year • Total year to date • Total year to date compared to last year to date • Amount difference • % Difference | Ratios: • visit average (shows patient retention) • Collections percent (shows the efficiency of the collections dept.) • Collection per visit • Charge per visit • Collection per new patient |
|
| Marketing: • Sources of New Patients • First visit-NP percent • Types of New Patients by payment • # opens and clicks on newsletter • Cost per new patient | Financial: (Quarterly) • Cost per new patient • Net income • Expenses • Overhead % |
|