
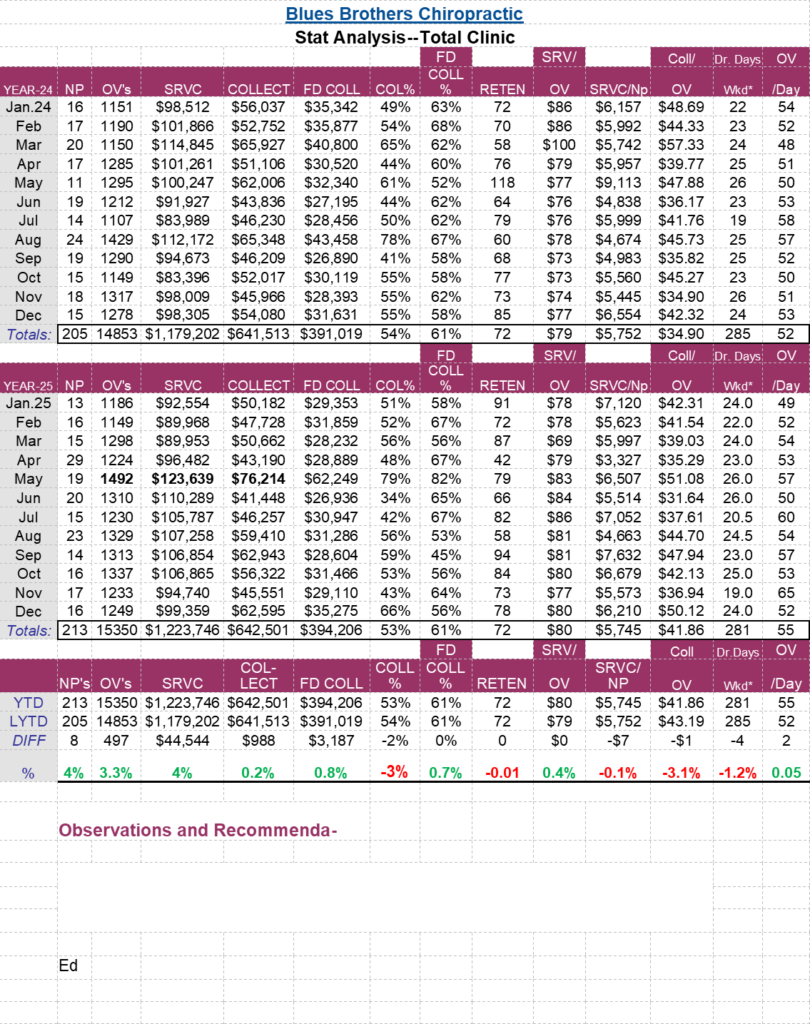
Monthly statistics:
- Track New Patients, Patient Visits, Services and Collections.
- Current month compared to the prior month
- Current month compared to the same month of the prior year
- Total year to date
- Total year to date compared to last year to date
- Amount difference
- % Difference
Ratios:
- Visit average (shows patient retention)
- Collections percent (shows the efficiency of the collections dept.)
- Collection per visit
- Charge per visit
- Collection per new patient
Marketing:
- Sources of New Patients
- First visit-NP percent
- Types of New Patients by payment
- # opens and clicks on newsletter
- Cost per new patient
Financial: (Quarterly)
- Cost per new patient
- Net income
- Expenses
- Overhead %
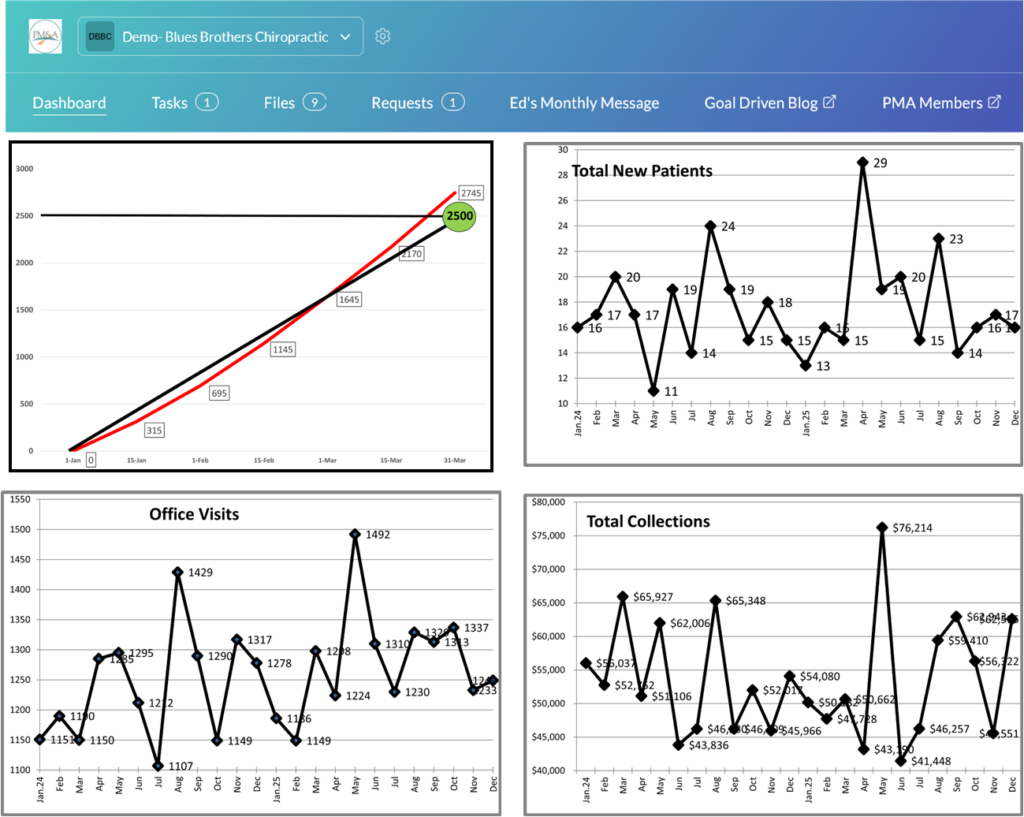
Charts and Graphs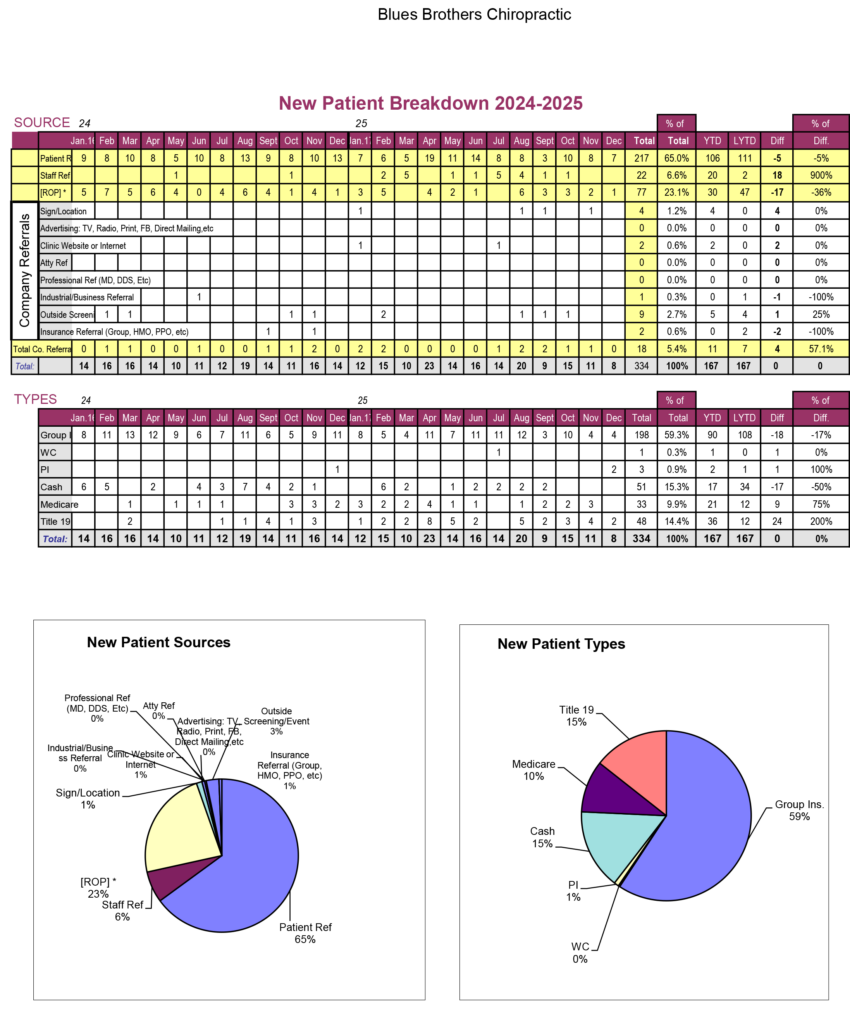
A picture is worth a thousand numbers, and a simple chart gives you the big picture and tells you if you are headed up or down.
This is what you will see first when you open your portal – Room for 4 graphs
- Goal Graph. Shows in a glance if you are on track for 3-month goals.
- Monthly graphs for:
o Visits
o New Patients
o Collections
We also create other charts for your easy access.