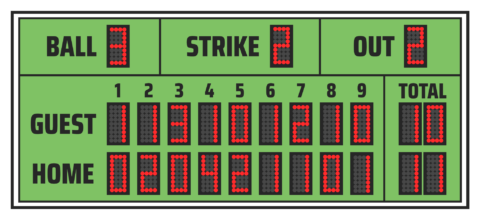
Your Goal Driven Analytics Scoreboard
Sometimes you can’t see the forest for the trees.
Sometimes you think things are worse than they are.
But then again, sometimes you think things are going better than they are. And then, BANG! Poop hits the fan!
What is the best way to determine how your business is doing?
Your Scoreboard
Your numbers are the best indicator of your Key Performance Indicators. They are your dashboard. Your Google maps. Your altimeter, as you take your business off the runway and up towards your goals.
In our consulting work, too often we see major management changes based on a minor error, hearsay, or emotions. This can have long-term devastating results.
On the other hand, improvements that show up on the stats can be ignored if no one is watching them.
One office we worked with continued to see an increase in new patients referred from a local gym. But amidst the busyness of the daily patient care, they hadn’t noticed. Since we closely monitored their numbers, I saw this increase in new patients from a local business on their New Patient Tracker. After discussing this with the doctor and manager, they finally took action to strengthen this valuable relationship. Last I heard, they are continuing to get referrals from this location.
You can miss the good things — as well as the coming crash. Numbers help you predict what needs fixing before things get ugly and what needs reinforcement to keep the good times going.
Ultimately, statistics tell you if you are moving towards your goals or away from them.
Unfortunately, most offices do not keep clear and consistent track of their numbers.
As a result, business owners do not get the information they need to manage their business properly. Software can spit out reports which can help, but they are not enough. And usually only partly used, if at all.
Here are some fast tips for your stat analysis scoreboard:
- Key numbers. Monitor numbers week-to-date and month-to-date, especially new patients, visits, charges, and collections.
- Individual providers. If you have multiple providers, find some way to measure their production. This can help both of you manage performance.
- Percentages. Use percentages, such as visits divided by new patients, to give you an idea of how long your patients are staying with you.
- This year to last year. You should be able to compare this year-to-date with last year-to-date.
- Line charts. We use line graphs plotted over a couple of years. These clearly show what is trending — up or down.
- New patients. Track the sources of your new patients as well as the types of new patients.
- Weekly reports. Have someone in your office give you a daily, or at least a weekly and monthly statistical report.
Keeping statistical analysis in place has proven so valuable for offices that many clients have asked us to keep providing their stat analysis for them years after completing an intensive service with us.
While this is not a major service we offer, we realize how useful it is in our Goal Driven System of management.
Therefore, we have decided to start offering our Goal Driven Analytics program as a service to more offices.
We are only taking 5 new clients on this program for now, first come, first serve. It is moderately priced and, as most of our clients can verify, managing by the numbers is invaluable. To learn more about the program, we’ve posted some more info, with the link below. If interested, just reply to this email, and we can set up a time go over the details.
But whether we provide you with your statistical analysis or you set it up yourself, I can’t recommend a more valuable management tool for managing your business profitably. Not only is it effective, but it is fast!
Your analytics scoreboard will help you smoothly navigate to your goals.
To your greater prosperity,
Ed
